
TL;DR:
- Consistent tracking of GTA industrial market reports reveals critical supply and demand shifts that influence leasing and investment decisions.
- This detailed data, including net absorption, vacancy rates, and construction pipelines, helps owners and tenants avoid costly mistakes and negotiate effectively.
If you questioned why track market reports during a period of economic turbulence, the GTA industrial sector's 2025 performance answers that directly. While headlines focused on tariff uncertainty and rising borrowing costs, the market quietly absorbed 3.6 million square feet of net new occupancy and tightened to a 4.3% availability rate. That kind of movement creates real winners and real losers depending on who was watching the data and who was not. For GTA industrial property owners and corporate tenants, consistent report tracking is not a background activity. It is how you avoid costly mistakes and find the windows others miss.
Table of Contents
- Why track market reports: what the data reveals for GTA industrial
- Interpreting rent and sublet trends to negotiate better leases
- Using market reports to anticipate industrial sector shifts and risks
- Locally focused reports: why GTA owners and tenants need targeted market insights
- Why many overlook the full value of market report tracking and what to do instead
- How Michael Law commercial real estate supports your GTA industrial market strategies
- Frequently asked questions
Key Takeaways
| Point | Details |
|---|---|
| Market data guides decisions | Tracking GTA industrial reports helps owners and tenants understand supply, demand, and rent trends to negotiate smarter leases. |
| Local insights matter | Submarket reports reveal geographic variations critical for targeted leasing and investment strategies in GTA regions. |
| Timing is key | Regularly reviewing reports uncovers windows of opportunity in tightening markets before conditions shift. |
| Interpret with expertise | Combining data with professional insight prevents misreading trends and improves outcomes. |
| Reports track market phases | They reveal sector normalization, construction pipelines, and risks that affect leasing and investment timing. |
Why track market reports: what the data reveals for GTA industrial
Understanding industrial property trends begins with knowing what market reports actually measure. These are not vague sentiment surveys. They track hard numbers: net absorption (how much space tenants newly occupied versus vacated), availability rates, asking rents, sublet volumes, and construction pipelines. Each metric tells a different part of the same story.
Net absorption is arguably the most telling number in any industrial market report. When absorption is positive, tenants are taking up more space than they are giving back. Full-year 2025 net absorption reached 3.6 million sf across the GTA, with the availability rate declining 40 basis points year over year to 4.3%. For context, many global industrial markets consider anything below 5% to be functionally tight. That one data point tells you the GTA is not a buyer's market. It is a market where tenants who wait lose ground.
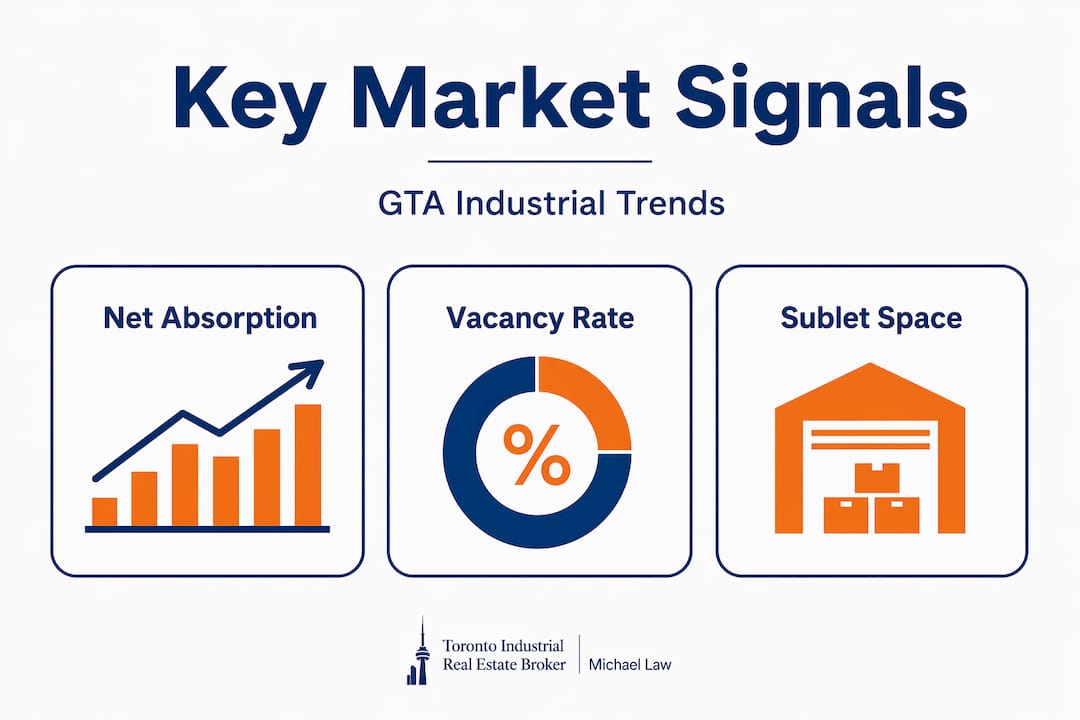
Sublet space is another signal that rarely gets enough attention. When sublet availability drops sharply, it means fewer tenants are trying to offload space, which suggests confidence in occupancy and tighter overall options for incoming tenants. A 27% yearly drop in sublet availability is not background noise. It tells you that the secondary market is closing fast and that the window for finding flexible, lower-cost sublet space is narrowing. That is exactly the kind of nuance you only catch if you are tracking reports consistently.
Key supply and demand indicators to monitor each quarter
| Indicator | What it measures | Why it matters to you |
|---|---|---|
| Net absorption | Net change in occupied space | Signals market strength or weakness |
| Availability rate | Share of space actively marketed | Benchmarks your negotiating position |
| Sublet volume | Space offered by existing tenants | Reveals hidden inventory and tenant confidence |
| Construction pipeline | Space under development | Forecasts future supply pressure |
| Asking net rent | Average marketed rent per square foot | Sets expectations for lease negotiations |
The importance of market reports comes down to this: without them, you are negotiating or investing based on assumptions. With them, you are working from facts.
"Tracking market reports regularly turns abstract economic noise into specific, actionable signals. In a market like the GTA, where conditions can shift meaningfully between quarters, that difference is often measured in dollars per square foot."
Pro Tip: Review reports at the submarket level, not just the GTA-wide summary. GTA industrial vacancy data at the submarket level can vary by several percentage points from the headline figure, which changes your negotiating position entirely.
Interpreting rent and sublet trends to negotiate better leases
After understanding supply and demand metrics, the next step is interpreting pricing and lease terms for tactical benefit. Rent data is where the benefits of tracking market data become most immediately tangible for both sides of a lease transaction.
GTA industrial asking net rents averaged $16.56 PSF in Q4 2025, down 6.6% year over year but still up 65% over five years. That five-year lens is critical. A tenant negotiating today who only sees the short-term dip might push hard on rent and miss that landlords have a very long runway of value appreciation behind them. Understanding the full rent cycle prevents you from misreading a temporary softening as a structural shift.
For tenants, the current combination of modestly declining asking rents and sharply reduced sublet availability creates a specific negotiating window. You have slightly more pricing leverage than a year ago, but fewer alternative options to point to. That combination rewards tenants who come to the table with hard data, not just anecdotal comparisons to what a colleague paid two years ago.
For landlords and property owners, rent trend data supports pricing discipline. When you can show a prospective tenant that your asking rate sits at or below the GTA average for comparable product, the conversation shifts. You are no longer defending a number. You are contextualising it with evidence. That is a very different negotiation. Tracking GTA industrial rent strategies over time also helps landlords plan capital improvements at the right point in the cycle, when upgrades will support rent premiums rather than simply maintain occupancy.
Five ways rent data directly improves lease outcomes
- Benchmark asking rates against current market averages to confirm whether a landlord's pricing is justified or inflated for the submarket.
- Identify softening windows when asking rents are declining quarter over quarter, creating room to negotiate net rent, free rent periods, or tenant improvement allowances.
- Anticipate rent escalation clauses by reviewing historical rent growth trends to assess whether proposed annual increases are reasonable or aggressive.
- Evaluate sublet options by comparing sublet pricing against direct lease rates, especially when sublet volume is tightening and the gap is narrowing.
- Support renewal negotiations with five-year rent trend data that shows where the market is heading, not just where it sits today.
Rent trend comparison: negotiation context by period
| Period | Avg. asking net rent (PSF) | Market condition | Negotiation posture |
|---|---|---|---|
| 2020 | ~$10.00 | Tight, rising | Limited tenant leverage |
| 2022 | ~$13.50 | Very tight, peak demand | Near zero tenant leverage |
| 2024 | ~$17.72 | Normalising, slightly softer | Moderate tenant leverage |
| Q4 2025 | $16.56 | Tightening supply, rent dip | Targeted tenant opportunity |
Understanding industrial rent escalation cycles matters because the dip you see today may not last. And understanding GTA industrial subleasing dynamics helps you evaluate whether a sublet opportunity is a good deal or a sign of a distressed tenancy.
Pro Tip: When reviewing rent data, always ask for the spread between asking and achieved rents. Reports typically publish asking rates. The actual transaction rents, which brokers track separately, can be 5% to 10% lower in soft periods, giving you a more accurate negotiation baseline.
Using market reports to anticipate industrial sector shifts and risks
Beyond pricing, knowing broader market cycles and risks solidifies confident planning. One of the most underappreciated reasons to monitor market reports is what they reveal about timing. Not just where the market is today, but where it is heading and what risks might change that trajectory.
The construction pipeline is a leading indicator that most tenants and even some landlords ignore entirely. When new supply is abundant, landlords compete harder for tenants. When it dries up, they do not have to. GTA's construction pipeline fell to 9.1 million sf under active construction, down from 19.5 million sf three years prior. Peak land costs are delaying new development by 18 to 24 months. If you are not tracking this, you will not see the rent rebound coming until it has already arrived.

The national picture adds important context. NAR's February 2026 commercial report shows that while completions have been exceeding new leasing activity in several North American industrial markets, the imbalance is narrowing. That narrowing gap is the signal that stabilisation is 6 to 12 months away. For an investor considering an acquisition or a tenant weighing a five-year lease commitment, that forecast window matters enormously.
Risk factors also appear in market reports in ways that are easy to miss if you only skim headlines. Tariff-related demand uncertainty, shifts in e-commerce order volumes, and interest rate movements all affect absorption and investment appetite. A well-read market report will flag these as headwinds and let you model scenarios accordingly.
- Watch completions vs. leasing velocity to identify when new supply will stop absorbing smoothly and vacancies will begin to rise.
- Track pre-leasing rates on new construction as a proxy for tenant demand confidence in specific submarkets.
- Monitor interest rate commentary in investment-focused reports to gauge cap rate movement and acquisition pricing.
- Note changes in average deal size because a shift from large-format to mid-bay leasing signals a change in the types of tenants active in the market.
- Read commentary on trade and tariff exposure because logistics and distribution tenants who drive GTA absorption are directly affected by cross-border trade volumes.
"The most valuable thing a market report tells you is not where rents are today. It is how much runway is left before conditions shift. That is the insight that turns data into decisions."
Understanding the value of market analysis goes beyond quarterly rent tracking. It is about building a mental model of the market that gets updated with each new data release, so that your decisions are always rooted in current reality.
Locally focused reports: why GTA owners and tenants need targeted market insights
After understanding broad market factors, zooming into the GTA's specific submarkets sharpens execution considerably. The GTA is not one industrial market. It is a collection of distinct corridors, each with its own supply dynamics, tenant mix, land constraints, and demand drivers.
GTA West, which includes the Mississauga Airport Corridor, Brampton, and Milton, is the highest-demand industrial corridor in Canada. Vacancy in GTA West fell to 4.7% with sublet absorption down 32% from the Q2 2025 peak. That is meaningfully tighter than some East GTA nodes where vacancy is slightly higher and landlord incentives are more available. If you are a tenant choosing between locations, that spread tells you where you have more leverage and where you are competing harder for less space.
The North GTA corridor, covering Vaughan and Markham, serves a different tenant profile dominated by light manufacturing, distribution hubs, and import-focused logistics. Reports that track this submarket separately reveal a different absorption story than GTA West. The East GTA corridor through Pickering, Ajax, Whitby, and Oshawa is now attracting larger-format warehousing users priced out of core GTA markets, which means vacancy there is tightening faster than broad GTA figures suggest.
GTA submarket snapshot: key differentiators for decision-making
| Submarket | Primary tenant profile | Market characteristic | Relative leverage |
|---|---|---|---|
| GTA West (Mississauga/Brampton) | Logistics, e-commerce, 3PL | Tightest market, lowest vacancy | Minimal tenant leverage |
| North GTA (Vaughan/Markham) | Manufacturing, distribution | Stable, limited new supply | Moderate tenant leverage |
| East GTA (Durham Region) | Large-format warehousing | Emerging demand, value pricing | Some tenant leverage |
| Toronto core | Last-mile, urban logistics | Severely supply-constrained | Very limited options |
Understanding where industrial tenants cluster by submarket tells you a great deal about demand sustainability. A submarket dominated by e-commerce and 3PL tenants is more sensitive to consumer spending shifts. One anchored by manufacturing is more resilient. Reports that break down absorption by tenant type within a submarket give you that edge.
For property owners, knowing which industrial space amenities are commanding premiums in specific submarkets helps prioritise capital expenditure. A dock-level loading upgrade matters more in a GTA West logistics corridor than in a mixed-use North GTA park where clear height and power capacity are the differentiating factors.
- Submarket vacancy rates can vary by 2 to 4 percentage points from the GTA-wide average.
- Sublet tightening often happens faster in high-demand nodes before it shows up in overall GTA figures.
- New construction timing differs significantly by corridor due to land availability and municipal approvals.
- Tenant demand drivers are corridor-specific, which affects how quickly vacant space gets absorbed.
Why many overlook the full value of market report tracking and what to do instead
Here is the honest reality. Most industrial owners and tenants do look at market reports occasionally. They download a quarterly PDF, scan the headline rent number, note whether vacancy is up or down, and move on. That is not market intelligence. That is a habit that creates the illusion of being informed while leaving the real insights unread.
The problem is not access to data. Reports from major commercial brokerages are widely available and frequently updated. The problem is that most readers do not know what question they are trying to answer before they open the report. They read passively rather than analytically. And without context built from consistent tracking over time, a single report tells you surprisingly little. It is the change between reports where the signal lives.
Consider a tenant approaching a lease renewal. They check one recent report and see that asking rents are down year over year. They feel confident pushing for a lower rate. But a reader who has been tracking reports consistently over 12 months would notice that sublet availability dropped sharply in the same period, and that the construction pipeline shrank by more than half. Those two facts together mean the rent dip is temporary and that supply pressure is building. The informed tenant would still negotiate hard today, but they would also lock in a longer term at today's favourable rate rather than opting for a short renewal hoping to do better next year.
The other common failure is reading reports in isolation without expert interpretation. Market data without context can mislead. A rising vacancy rate in one submarket might reflect a single large tenant moving out, not a broad weakening. A spike in sublet availability might be one corporate restructuring, not a sector shift. Knowing the difference requires both consistent tracking and someone with enough transactional experience to read the signal correctly.
The most competitive owners and tenants in the GTA industrial market treat report tracking as a continuous practice, not a periodic event. They review quarterly reports within days of publication. They note shifts from the prior quarter. They bring specific data points into every lease negotiation and investment conversation. That discipline compounds over time into a genuine informational edge.
How Michael Law commercial real estate supports your GTA industrial market strategies
Tracking market reports consistently is the foundation of every sound leasing and investment decision in the GTA industrial sector. But data alone is only half the picture.
At Michael Law Real Estate, we combine institutional-grade market report analysis with deep, on-the-ground knowledge of GTA industrial submarkets from Caledon to the Toronto core. Our team helps property owners and corporate tenants interpret the numbers that matter most, translate them into specific negotiating positions, and act with confidence whether you are signing a new lease, renewing, or evaluating an acquisition. If you want to turn market data into better real estate outcomes, explore how we work with clients across every major GTA corridor. The right guidance does not just save you time. It changes what you are able to negotiate. Connect with our team to get started.
Frequently asked questions
What are market reports and why are they important for GTA industrial real estate?
Market reports provide detailed, regularly updated data on supply, demand, rents, vacancy, and leasing activity across GTA industrial submarkets, giving owners and tenants the factual basis for confident decisions. Avison Young's Q4 2025 data on absorption and availability benchmarks exactly how tight or competitive each submarket currently is.
How often should industrial property owners and tenants review market reports?
Monthly or quarterly review is the minimum recommended frequency, particularly in a dynamic market like the GTA where conditions can shift meaningfully between reporting periods. Waiting until a lease event forces you to look at the data means you have already missed the best negotiating windows.
Can market reports predict future industrial rent trends in the GTA?
Reports cannot predict rents with certainty, but they provide forward-looking signals through construction pipeline data and absorption trends that meaningfully narrow the range of likely outcomes. NAR's February 2026 findings on the narrowing supply-demand imbalance suggest stabilisation is 6 to 12 months out for many North American industrial markets.
What local factors should I consider alongside market reports for GTA industrial properties?
Submarket vacancy differences, specific tenant demand by corridor, new construction timing, and land cost constraints unique to areas like Caledon, the Toronto core, or GTA West all add crucial nuance that GTA-wide figures can obscure. Submarket-level data such as GTA West's 4.7% vacancy consistently reveals faster tightening than the headline number suggests.