
TL;DR:
- GTA industrial cap rates have compressed to 4.0–4.5% in 2026, indicating strong investor confidence amid rising property values. Cap rates, calculated by dividing NOI by purchase price, reveal market sentiments and risk levels; however, their effectiveness depends on verifying income and considering lease quality. Investors should evaluate income stability, tenant profile, lease terms, and location to accurately assess property value in this tight market environment.
If you've been watching GTA industrial real estate in 2026, you've likely noticed something that seems almost counterintuitive: prime industrial cap rates have compressed to just 4.0–4.5%, down from 6.0% only six years ago. That compression signals fierce investor confidence, but it also makes understanding industrial cap rates more critical than ever. A property that looks expensive on paper may be exactly the right buy. One that looks like a bargain may carry risks the headline number hides entirely. This guide cuts through the noise and gives you the tools to read, compare, and act on cap rate data with confidence.
Table of Contents
- What is a cap rate and how is it calculated?
- Industrial cap rates in the GTA in 2026: The data and trends
- Key factors that affect industrial cap rates
- When cap rates don't apply: Valuing vacant or owner-occupied industrial properties
- How to use cap rates in your GTA industrial property strategy
- A fresh perspective: Why cap rates are only one piece of the industrial property value puzzle
- Connect with GTA industrial investment experts
- Frequently asked questions
Key Takeaways
| Point | Details |
|---|---|
| Cap rate basics | Cap rate is a quick measure of a property’s expected return based on its income and value. |
| GTA market trends | In 2026, GTA industrial cap rates are at record lows, reflecting strong demand and competitive market conditions. |
| Drivers of cap rates | Location, tenant stability, building condition, and market cycle all significantly affect industrial cap rates. |
| Exceptions to cap rate use | Vacant or owner-occupied properties require different valuation approaches than leased properties. |
| Smart application | Successful GTA investors supplement cap rate analysis with deeper due diligence and market insight. |
What is a cap rate and how is it calculated?
Cap rate, short for capitalisation rate, is the single most widely used metric in commercial real estate valuation. It tells you what return a property would generate if you bought it outright with no debt. Simple in concept, powerful in practice.
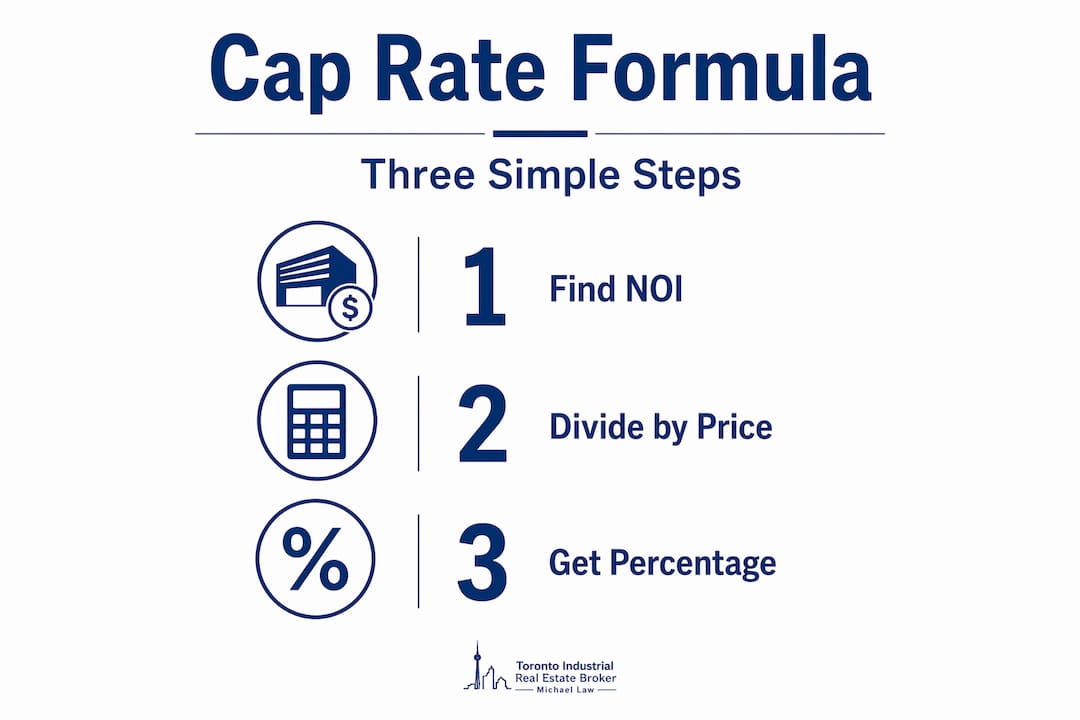
The formula is straightforward. Cap rate equals NOI divided by the property's purchase price or market value, expressed as a percentage. If a warehouse generates $400,000 in net operating income annually and you paid $8,000,000 for it, your cap rate is 5.0%. That single number lets you compare that property against every other industrial asset in the GTA, regardless of size or location.
What goes into NOI?
Net operating income is gross operating income minus operating expenses. It includes base rent, recoveries from tenants, and any ancillary income. It excludes mortgage payments, income taxes, and depreciation. Those are financing and accounting decisions that vary by buyer. NOI strips them out to reveal the property's pure operational performance.
One item that trips up even experienced investors is capital expenditures. CapEx is excluded from NOI because it falls below the operating line. A new roof, dock leveller replacements, or HVAC upgrades are not reflected in the cap rate calculation. This matters enormously when you are evaluating an older building in Brampton or Mississauga where deferred maintenance may be substantial.
A quick-reference cap rate table
| Property value | Annual NOI | Cap rate |
|---|---|---|
| $5,000,000 | $200,000 | 4.0% |
| $5,000,000 | $250,000 | 5.0% |
| $8,000,000 | $400,000 | 5.0% |
| $10,000,000 | $450,000 | 4.5% |
| $12,000,000 | $540,000 | 4.5% |
Notice how the same cap rate can represent very different dollar amounts. That is why understanding property valuation through cap rates requires you to always anchor the percentage to real income figures, not just the percentage alone.
Pro Tip: Always verify what the seller has included in NOI. Property management fees, insurance, and maintenance are legitimate operating expenses. If a seller has excluded them to inflate NOI, the stated cap rate will be misleading. Ask for a full income and expense statement, not just the summary.
For a deeper look at finding value in GTA properties, the methodology behind cap rate analysis connects directly to how experienced buyers screen deals before they ever tour a building.
Industrial cap rates in the GTA in 2026: The data and trends
With a clear formula in mind, let's look at what GTA industrial cap rates actually are right now and why the numbers matter.
The GTA is one of the most tightly priced industrial markets in North America. Prime GTA industrial cap rates sit at 4.0–4.5% in 2026, with infill product trading at 4.0% and suburban assets ranging from 4.5% to 5.0%. Compare that to US national industrial cap rates of 6.0–6.2% and the gap becomes stark. GTA industrial assets are priced at a significant premium to most American markets.
GTA vs. US industrial cap rate comparison (2026)
| Market | Cap rate range | Trend vs. 2020 |
|---|---|---|
| GTA prime (infill) | 4.0% | Compressed from 6.0% |
| GTA suburban | 4.5–5.0% | Compressed from 5.5–6.0% |
| US national average | 6.0–6.2% | Slight compression expected |
What does this compression actually mean for you? Two things. First, it means property values have risen dramatically relative to income. A building generating $500,000 NOI that traded at a 6.0% cap in 2020 was worth roughly $8.3 million. At today's 4.5% cap, that same income stream is worth $11.1 million. The income did not change. The market's confidence in that income did.
Second, it means the margin for error is thin. Lower cap rates signal higher values and reduced perceived risk, but they also mean any disruption to income, whether a vacancy, a rent dispute, or an interest rate spike, hits harder relative to what you paid.
The GTA's compressed cap rate environment is not irrational. It reflects genuine scarcity. Industrial land in Toronto, Mississauga, and Vaughan is finite. Logistics demand driven by e-commerce, last-mile delivery, and reshoring of manufacturing is real and growing. Investors are pricing in long-term income security, not just today's rent.
For a full picture of GTA trends for industrial real estate and how GTA submarket demand varies across corridors, the data tells a nuanced story that raw cap rate averages alone cannot capture.
Key factors that affect industrial cap rates
Understanding headline numbers is one step. It is equally important to grasp what makes cap rates differ from one industrial property to another, even within the same postal code.
Location within the GTA
Infill properties in Toronto's inner ring, areas like Etobicoke, North York, and East Toronto, trade at the tightest cap rates because land scarcity makes replacement nearly impossible. Suburban nodes in Brampton, Vaughan, and Markham sit slightly higher. Secondary markets like Oshawa, Hamilton, and Barrie carry wider caps reflecting longer lease-up timelines and less liquidity.
Tenant quality and lease structure
A building fully leased to a national logistics operator on a ten-year net lease is fundamentally different from one leased to a small manufacturer on a month-to-month basis. Strong tenants with long-term leases compress cap rates because the income is predictable and the risk of vacancy is low. Buyers pay a premium for certainty. Conversely, short-term leases or tenants with weak credit profiles widen cap rates to compensate for income risk.
Building age and physical condition
Modern clear heights of 36 to 40 feet, ESFR sprinkler systems, ample trailer parking, and efficient column spacing all command tighter cap rates. Older buildings with 18-foot clear heights, limited dock doors, and deferred maintenance trade at wider caps. The functional obsolescence of older stock is a real discount factor, particularly as tenants' operational requirements continue to evolve.
Macroeconomic conditions
Interest rates are the invisible hand behind cap rate movement. When borrowing costs rise, buyers require higher returns to justify the spread between their debt cost and the property's yield. Market conditions and interest rates directly widen or compress caps depending on the cycle. The Bank of Canada's rate decisions in 2025 and 2026 have been closely watched by every GTA industrial investor for exactly this reason.
Pro Tip: When comparing two properties with similar cap rates, look at the weighted average lease term (WALT) and the tenant's credit profile before anything else. A 4.5% cap on a ten-year lease with a creditworthy tenant is not the same deal as a 4.5% cap on a two-year lease with a regional operator, even though the numbers look identical.
Understanding why trends matter for leases and how GTA vacancy impact flows through to cap rate movement gives you an edge most buyers simply do not have when they walk into a negotiation.
When cap rates don't apply: Valuing vacant or owner-occupied industrial properties
While cap rates are a mainstay for leased properties, there are important cases where you need a different valuation approach entirely.
Cap rate analysis requires income. No income, no cap rate. It sounds obvious, but it catches buyers off guard more often than you might expect. Vacant and owner-occupied properties cannot be valued using the cap rate method because there is no stabilised NOI to divide. Applying a cap rate to a vacant building would require you to assume a market rent, a lease-up period, and a stabilisation timeline, all of which introduce subjectivity that distorts the number.
Three alternative valuation methods for these situations:
-
Price per square foot (PSF) comparables. This is the most common alternative. You look at recent sales of similar industrial buildings in the same submarket and calculate what buyers paid per square foot of gross leasable area. In the GTA, PSF values for functional industrial product range widely by location, age, and clear height, but this method gives you a market-anchored reference point without requiring income data.
-
Replacement cost analysis. What would it cost to build the same building today, including land, hard construction costs, and soft costs? In land-constrained GTA submarkets, replacement cost often sets a floor on value. If you can buy an existing building for less than it would cost to replicate it, you have a potential value play.
-
Lease-up analysis. This approach estimates what the property would be worth once stabilised at market rent, then discounts back for the time, cost, and risk of achieving that stabilisation. It is the most sophisticated of the three and requires solid knowledge of current market rents and absorption rates.
"The cap rate is a tool, not a verdict. For vacant buildings, the real question is not what it earns today but what it will earn once stabilised, and how long and costly that journey will be."
For a thorough walkthrough of how these methods apply in practice, the industrial investment sales guide covers GTA-specific scenarios in detail.
How to use cap rates in your GTA industrial property strategy
Now that you know the exceptions, let's focus on using cap rates to your practical advantage when negotiating or investing in industrial properties today.
A step-by-step screening process:
-
Obtain the full rent roll and operating cost statement. Do not rely on the broker's summary. Get the actual lease documents, tenant names, lease expiry dates, and a 12-month operating expense history. This is your raw material for calculating real NOI.
-
Reconstruct NOI independently. Take gross rental income, add any tenant recoveries, then subtract verified operating expenses. Do not let the seller's NOI figure go unchallenged. Common inflations include excluding management fees or understating maintenance costs.
-
Apply the market cap rate for that asset type and location. Use GTA cap rates of 4–5% for prime industrial as your benchmark. If the asking price implies a cap rate materially below market, you need a compelling reason, such as exceptional lease term or tenant credit, to justify the premium.
-
Stress-test the numbers. What happens to your return if rates rise 100 basis points? What if the anchor tenant vacates at lease expiry? Run the scenarios before you are emotionally committed to a deal.
-
Compare across deals, not in isolation. A single cap rate number means little without context. Build a short-list of comparable properties and rank them by cap rate, lease term, and tenant quality simultaneously.
Mistakes to avoid in 2026's compressed market:
- Accepting a seller's NOI without independent verification
- Ignoring CapEx requirements in older buildings, which the cap rate does not capture
- Treating all 4.5% cap rates as equivalent regardless of lease structure or tenant profile
- Overpaying for perceived scarcity without confirming that the income is genuinely sustainable
Pro Tip: In a market where cap rates are this compressed, the quality of the lease matters more than the cap rate itself. Two properties at identical cap rates can have dramatically different risk profiles depending on whether the lease has annual rent escalations, who is responsible for capital repairs, and how many years remain on the term.
Pairing cap rate analysis with strategies for better leases and property resilience insights gives you a complete picture that most investors only develop after making expensive mistakes.
A fresh perspective: Why cap rates are only one piece of the industrial property value puzzle
Here is something that experienced GTA industrial investors rarely say out loud: cap rates are a lagging indicator dressed up as a forward-looking tool. They tell you what the market paid for income in the past. They do not tell you whether that income will hold, grow, or collapse over the next five years.
In a compressed market like the GTA in 2026, this distinction is critical. When cap rates were at 6.0% in 2020, the spread between cap rates and borrowing costs gave investors a meaningful cushion. Today, with prime assets trading at 4.0% and financing costs meaningfully higher than they were at the peak of the rate compression cycle, that cushion has narrowed considerably. The numbers still work for many deals, but the margin for error is genuinely thin.
What separates sophisticated GTA industrial investors from the rest is not their ability to calculate a cap rate. Anyone can do that in thirty seconds. What separates them is their ability to evaluate the quality of the income behind the cap rate. Is the tenant growing or contracting? Does the lease have meaningful rent escalation clauses, or is the rent fixed for a decade at below-market rates? Is the building functionally competitive with new supply being built in Milton or Caledon, or will it struggle to re-lease at current rents when the term expires?
There is also a qualitative dimension to location that cap rates cannot capture. A 4.2% cap rate on an infill Toronto asset near a major 400-series highway interchange is not the same as a 4.2% cap rate on a suburban property with limited truck access and an aging labour pool. The number is identical. The underlying asset is not.
The most common mistake we see is investors anchoring too hard on the cap rate and too lightly on the lease. A ten-year lease with 2.5% annual rent escalations on a modern 36-foot clear building in Mississauga is worth more than a ten-year lease at flat rent on a 22-foot clear building in a secondary submarket, even if both trade at the same cap rate today. The divergence becomes visible at renewal, and by then it is too late to renegotiate your purchase price.
Cap rate analysis is the starting point, not the finish line. The investors who consistently outperform in the GTA industrial market treat it as one input among many, alongside advanced GTA trends, lease structure analysis, and a clear view of where supply and demand are heading in each submarket.
Connect with GTA industrial investment experts
Understanding cap rates puts you ahead of most market participants. But knowing the formula is different from knowing which deals are actually worth pursuing in Brampton versus Vaughan, or why a 4.8% cap in Ajax might outperform a 4.2% cap in Mississauga over a ten-year hold. That is where deep local expertise makes the difference.
At Michael Law Real Estate, we provide institutional-grade cap rate analysis, lease structure review, and submarket intelligence across every major GTA industrial corridor. Whether you are acquiring your first industrial asset, repositioning a portfolio, or evaluating a lease renewal against current market conditions, our team brings the data and transaction experience to help you make the right call. Browse current GTA industrial property listings or connect directly with our advisory team to discuss your specific situation. You can also learn more about our approach and track record through our profile at Lennard Commercial Realty.
Frequently asked questions
How do you calculate cap rate for an industrial property?
Cap rate equals NOI divided by the purchase price or current market value, expressed as a percentage. For example, $400,000 NOI on an $8,000,000 property equals a 5.0% cap rate.
Why are GTA industrial cap rates so low in 2026?
Strong tenant demand, limited land supply, and investor confidence in long-term income stability have pushed prime GTA caps to 4.0–4.5%, down from 6.0% in 2020. Scarcity of functional industrial product in infill locations is the primary driver.
What is the difference between NOI and cap rate?
NOI is gross income minus operating expenses and represents the property's annual cash flow from operations. Cap rate converts that income into a return percentage relative to the property's value.
When should you not use cap rates to value a property?
Vacant or owner-occupied properties cannot be reliably valued using cap rates because there is no stabilised income to divide. Use PSF comparables, replacement cost analysis, or a lease-up model instead.
Do lower cap rates mean higher risk?
Lower cap rates indicate higher values and less perceived risk, reflecting strong demand and income certainty. Higher cap rates signal more risk or a discount to compensate for uncertainty, weaker tenants, or inferior locations.