
TL;DR:
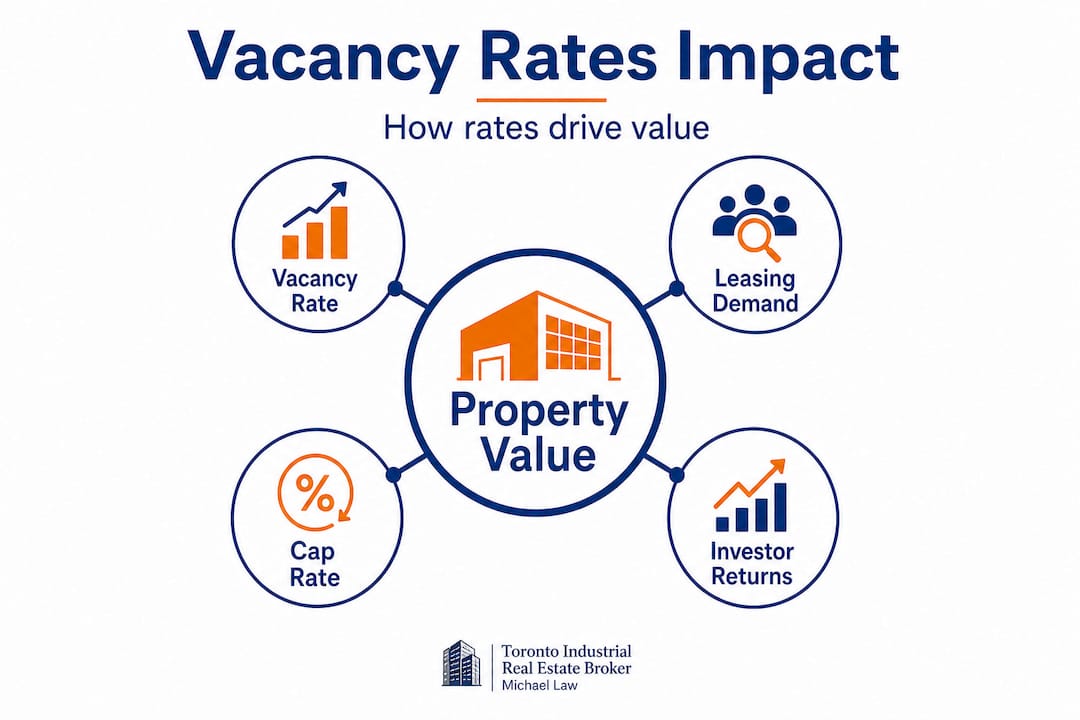
- Vacancy rates in the GTA directly influence property values, cap rates, and rental prices, serving as a key market indicator.
- Understanding the distinctions between direct, overall, and functional vacancy is essential for accurate market analysis and strategic decision-making.
Vacancy rates are far more than a simple count of empty warehouse bays. Many property owners, investors, and corporate tenants treat them as background noise, glancing at a headline number before moving on to what feels like the "real" analysis. That instinct is costly. Vacancy rates in the GTA directly impact cap rates and sale prices, making them a critical indicator for every participant in the industrial market. Understanding what these figures actually measure, and what they hide, can mean the difference between a well-timed acquisition and an expensive misstep.
Table of Contents
- What are industrial vacancy rates and how are they measured?
- Why vacancy rates drive property values and investment returns
- How GTA market trends and constraints shape vacancy rates
- Vacancy rates in practice: what every owner, investor, and tenant should watch
- What most market participants get wrong about vacancy rates
- Leverage GTA vacancy insights for your next industrial move
- Frequently asked questions
Key Takeaways
| Point | Details |
|---|---|
| Functional vs. headline rates | Always look beyond the headline numbers to assess what space is actually usable in the GTA market. |
| Low vacancy boosts value | Tight industrial vacancy rates directly translate to higher property values and lower investment risk. |
| Market forces matter | Persistent e-commerce demand and Greenbelt policy keep GTA vacancy rates unusually low. |
| Know your segment | Segment vacancy data by market, building type, and functionality to make smarter leasing or investment choices. |
What are industrial vacancy rates and how are they measured?
Before you can use vacancy data strategically, you need to understand what it is actually counting. An industrial vacancy rate expresses the percentage of total rentable industrial space in a given market or submarket that is not currently leased and occupied. Simple enough on the surface, but the definitions beneath that number get complicated fast.
Direct vacancy refers to space that a landlord is actively marketing as immediately available. Overall vacancy casts a wider net, incorporating sublease space (where an existing tenant is trying to offload their lease to another occupier) and sometimes space that will become available within a short forward window. These two figures can diverge sharply in periods of market stress, when corporate tenants facing financial pressure flood the sublet market while landlord-direct vacancy stays low.
Then there is the distinction that most headline reports gloss over entirely: functional vacancy versus headline vacancy. As the Toronto Commercial & Industrial Investment Guide 2026 points out, functional vacancy is meaningfully lower than the published number because obsolete space, such as buildings with low clear heights, inadequate truck court depth, or insufficient power supply, is effectively unusable for the majority of modern tenants. That space sits in the vacancy total but is never genuinely available to a logistics operator or e-commerce fulfilment user looking for a 36-foot clear distribution centre. You can also see examples of GTA vacancy levels across different property types to get a concrete sense of how much these numbers vary in practice.
Here is how the key measurement types compare:
| Vacancy type | What it counts | Best used for |
|---|---|---|
| Direct vacancy | Landlord-marketed available space | Occupier site searches |
| Overall vacancy | Direct plus sublet space | Broad market health |
| Functional vacancy | Modern, spec-compliant space only | Investment underwriting |
| Submarket vacancy | Rates within a defined geographic zone | Location-specific decisions |
A few important nuances to keep in mind:
- Submarket variations are wide. A GTA-wide vacancy figure of 4% could mean 2% in Mississauga Airport Corridor and 8% in an older node with aging stock.
- Building size tiers matter. Vacancy in large-bay spaces above 100,000 square feet often tracks very differently from small-bay multi-tenant industrial, which houses a different tenant base entirely.
- New supply temporarily inflates rates. When a significant new building is delivered but not yet leased, it spikes vacancy until absorption catches up.
- Forward-looking supply affects asking rents before vacancy even moves. Landlords watch planned deliveries as closely as current rates.
Pro Tip: When reviewing any vacancy report, always ask whether the figure is direct or overall, and whether it includes functionally obsolete space. These two clarifications alone will sharpen your interpretation of market conditions considerably.
Brokers use these distinctions to advise tenants on negotiating leverage and timing. Landlords use them to benchmark asking rents. Investors use them to stress-test cap rate assumptions. Each group needs a different slice of the same dataset.
Why vacancy rates drive property values and investment returns
Once you understand what vacancy rates measure, the connection to dollars becomes direct. Industrial real estate valuation is fundamentally linked to the income that a property generates, and the security of that income. Vacancy is the single most visible proxy for both.
"Tight vacancy in the range of 3 to 4 percent compresses cap rates from what might otherwise be 6 percent down to 4 to 4.5 percent, while simultaneously pushing sale prices into the $250 to $400 per square foot range across GTA industrial assets." — Toronto Commercial & Industrial Investment Guide 2026
Let us unpack that relationship step by step.
- Low vacancy reduces perceived risk. When the broader market has very little empty space, a landlord knows that if a tenant vacates, there is a large, motivated pool of replacement tenants ready to take possession. That risk reduction has direct value, and buyers pay for it by accepting a lower yield.
- Lower yields mean higher prices for the same income. A property generating $1 million in net operating income at a 6% cap rate is worth roughly $16.7 million. Price that same income at a 4.5% cap rate, reflecting tight market conditions, and the value jumps to $22.2 million. That is a $5.5 million gain tied directly to where vacancy rates sit in the market.
- Rental rate growth follows tight vacancy. When tenants have few choices, asking rents climb. Rising in-place rents increase net operating income, which compounds the upward pressure on asset values.
- Sale price per square foot benchmarks shift upward. As market rents increase and cap rates compress together, per-square-foot sale prices follow. Monitoring industrial property trends over multiple cycles confirms this pattern plays out consistently across GTA submarkets.
The reverse is equally important for owners to understand. When vacancy rises, even modestly, the chain runs backwards. Buyers demand higher yields to compensate for the added risk of re-leasing. Cap rates expand. Sale prices soften. A property that looked like a strong sale at 3% market vacancy may underperform at 7%.
Here is how the relationship between vacancy and investment metrics tends to shift across different market conditions:
| Market condition | Typical vacancy | Cap rate range | Approx. sale price |
|---|---|---|---|
| Very tight (landlord-favourable) | 2 to 4% | 4.0 to 4.5% | $300 to $400/sqft |
| Balanced | 5 to 7% | 4.5 to 5.5% | $200 to $300/sqft |
| Soft (tenant-favourable) | 8%+ | 5.5 to 6.5%+ | Below $200/sqft |
Savvy investors also use vacancy data to time acquisitions and dispositions. Buying into a submarket where vacancy is beginning to tighten after a period of elevated supply absorption is often the best entry point. Values have not yet fully reflected the shift in market conditions, but the direction is clear. Selling when vacancy is near historic lows and rents are peaking locks in maximum pricing. Neither move is possible without genuinely understanding what vacancy metrics are telling you.
How GTA market trends and constraints shape vacancy rates
The GTA industrial market does not behave like other North American markets, and understanding why helps investors and tenants avoid applying frameworks that do not fit. Several structural forces keep vacancy persistently low, even when significant new supply enters the market.
The most significant long-term driver of demand is the continued growth of e-commerce and supply chain restructuring. Canadian retailers and third-party logistics companies have been scaling their distribution networks rapidly, requiring large blocks of modern space close to major population centres. Toronto is the largest consumer market in Canada, and proximity to it commands a premium. That demand has absorbed wave after wave of new development without allowing vacancy to drift upward in any sustained way, as GTA industrial supply constraints underscore repeatedly.
The Greenbelt factor is structural and permanent. Development in the GTA is geographically constrained by the Greenbelt, a provincially protected green space belt that prevents sprawl in key directions. Unlike cities in the American Midwest or the southern United States where industrial land supply is effectively unlimited, GTA developers cannot simply build outward without limits. Every available hectare of serviced industrial land in and around Toronto is fiercely competed for, and the pipeline of future land ready for industrial development is genuinely finite.
Other forces driving persistent demand include:
- Nearshoring trends. As companies pull manufacturing and logistics functions back from overseas to reduce supply chain risk, Ontario's manufacturing base and infrastructure position it to capture a disproportionate share of that activity.
- Cold chain and food logistics growth. Refrigerated and temperature-controlled industrial space is in acute shortage across the GTA, with very little functional vacancy in that specialised segment.
- Last-mile delivery nodes. Demand for smaller, infill industrial properties close to dense residential areas in Toronto, Mississauga, and Vaughan is growing sharply as same-day delivery expectations intensify.
- Data centre and advanced manufacturing crossover. High-power industrial facilities are increasingly sought by tenants outside traditional warehousing, further tightening the available pool of functional space.
Current GTA industrial vacancy in many premier submarkets sits well below the national average, with top GTA submarkets by demand showing near-zero functional availability in select size ranges.
The implications of these constraints for tenants are significant. Waiting for better market conditions or expecting leverage to swing tenant-side is a risky strategy. In a market with true structural supply limits, sustained softening is unlikely. Tenants who understand industrial zoning in the GTA also gain an edge, since many of the most desirable industrial nodes have strong zoning protection that prevents conversion to residential or commercial uses, preserving the industrial supply base for the long term.
Pro Tip: If you are a tenant planning a site search, start at least 18 to 24 months before your current lease expires. In the tightest GTA submarkets, quality options at the size range above 50,000 square feet can be counted on one hand at any given moment. The lead time is not optional.
For owners, the structural supply story validates a long-term hold strategy in most scenarios. Industrial land in the GTA is not being replenished at a rate that will materially change the supply-demand balance within a typical investment horizon. For broader context on where the market is heading, GTA industrial trends for 2026 offers useful perspective on the forces currently shaping the landscape.
Vacancy rates in practice: what every owner, investor, and tenant should watch
Data is only valuable when it leads to better decisions. Here is a practical framework for applying vacancy rate intelligence across the three main user types: owners, investors, and tenants.
For investors conducting due diligence:
- Always request submarket-specific vacancy, not GTA-wide figures. A property in Burlington or Oshawa may sit in a submarket with very different vacancy dynamics than one in Brampton or Mississauga. Blended market figures will mislead you.
- Distinguish between functional and headline vacancy. As the Toronto Commercial & Industrial Investment Guide 2026 notes, GTA functional vacancy rates are consistently below headline numbers once obsolete space is excluded. If you are underwriting a modern distribution facility, the relevant competitive set is other modern facilities, not the entire building inventory.
- Track vacancy trends over four to six quarters, not just the current snapshot. A market at 5% vacancy but trending down is a fundamentally different investment thesis than one at 5% and trending up.
- Verify cap rate assumptions against actual market vacancy at the time of your hold period projection. Assuming today's 4.2% cap rate persists through a five-year hold when supply pipelines are large introduces meaningful risk.
- Assess building specification against tenant demand. A building with substandard clear heights, limited dock doors, or inadequate power may show as "available" in vacancy data but is functionally unleasable to the highest-value tenants.
For tenants making leasing decisions:
- Use vacancy data to assess your negotiating position before opening lease discussions. If your target submarket has 2% functional vacancy, you have minimal leverage and should focus on locking in the best terms available rather than pushing for concessions that will not come.
- Look beyond asking rent. In tight markets, landlords reduce free rent periods, limit tenant improvement allowances, and shorten lease flexibility options. These items are as costly as rent increases over a full lease term.
- Consider industrial amenity requirements early. Specific requirements like trailer parking, large truck courts, ESFR sprinkler systems, or high power availability dramatically narrow the available pool in an already tight market.
- Evaluate ESG factors in industrial space as part of your assessment. Modern tenants increasingly factor energy efficiency, carbon reporting capabilities, and building certifications into occupancy decisions, and these features are concentrated in a limited subset of the available stock.
For property owners and landlords:
- Monitor submarket vacancy quarterly. Knowing when conditions shift allows you to move asking rents up proactively or prepare for lease-up campaigns before a vacancy event occurs.
- Assess your building's functional position honestly. A clear height of 24 feet may have been standard when the building was constructed, but it places you in competition with a different and weaker tenant pool than modern 36-foot buildings.
- Use vacancy trends to time capital expenditure decisions. Upgrading a building during a tight market allows you to recover improvement costs through higher rents more quickly.
What most market participants get wrong about vacancy rates
Here is the uncomfortable truth that takes time to accept: the headline vacancy figure published in quarterly market reports is close to useless for making a specific real estate decision. It is useful for cocktail-party conversations about the market and for understanding broad directional trends. It is not a substitute for submarket-level, specification-adjusted, building-type-segmented analysis.
The most common mistake we see, across investors, tenants, and owners alike, is treating the GTA-wide vacancy rate as if it describes the conditions relevant to their specific situation. It almost never does. A tenant looking for 80,000 square feet of refrigerated space in Brampton is operating in a completely different supply reality than a user seeking 15,000 square feet of light manufacturing space in the east end of Toronto. Both of them would read the same headline number.
The second mistake is failing to account for functional obsolescence in the available pool. As modern GTA industrial specs make clear, functional vacancy in quality, specification-compliant buildings is meaningfully below what the headline number suggests. Investors who underwrite assets assuming they can easily re-lease to top-tier tenants at market rent need to verify that the building actually meets the specifications those tenants require. Many cannot.
The third mistake is ignoring the directional trend in favour of the point-in-time snapshot. A market moving from 6% to 3% vacancy is a fundamentally different investment environment than one moving from 3% to 6%, even if your specific transaction happens at a moment when both sit at 4.5%. The direction tells you where leverage is shifting, where rents are heading, and what kind of tenant demand is building or eroding. Tracking GTA investor trends over time is as important as reading the current snapshot.
The investors and tenants who consistently outperform in the GTA industrial market are those who build their own submarket-level picture, validate it against actual tours and broker intelligence, and act on it before the broader market reaches the same conclusion. Herd thinking in industrial real estate is expensive. By the time a trend shows up clearly in a published report, the best opportunities it reflects are usually already taken. The GTA industrial market moves fast, and nuanced, specification-adjusted, submarket-specific vacancy analysis is the framework that separates sharp participants from those who find themselves reacting rather than positioning.
Leverage GTA vacancy insights for your next industrial move
Understanding vacancy rates at a conceptual level is the starting point. Translating that understanding into a sound leasing, acquisition, or disposition strategy requires real-time submarket data, a clear view of functional supply, and experienced guidance through one of the most competitive industrial markets in Canada.
Michael Law Real Estate, affiliated with Lennard Commercial Realty, delivers institutional-grade market intelligence and transaction advisory across the full GTA industrial landscape, from industrial real estate in Caledon to core Toronto submarkets and every major node in between. Whether you are a tenant planning a long-term site strategy, an investor assessing acquisition timing, or an owner evaluating your portfolio's positioning in today's market, the depth of analysis applied to your situation makes a measurable difference. Reach out to discuss how current vacancy conditions in your target submarket should shape your next move.
Frequently asked questions
What is a healthy industrial vacancy rate in the GTA?
A healthy rate is typically considered to be in the 3 to 4 percent range, reflecting balanced supply and demand, though current GTA conditions with vacancy near 3.2 to 4 percent alongside cap rates of 4.0 to 4.5 percent confirm the market remains historically tight.
How do functional vacancy rates differ from headline rates?
Functional vacancy excludes obsolete or low-specification buildings that few modern tenants can actually use, meaning the true available supply of modern industrial space in the GTA is considerably smaller than the headline percentage suggests.
Why do vacancy rates affect sale prices and cap rates?
Low vacancy reduces the risk of income loss for a buyer, which investors price by accepting a lower yield, and tight vacancy of 3 to 4 percent has compressed GTA cap rates to 4 to 4.5 percent while pushing sale prices into the $250 to $400 per square foot range.
How do GTA vacancy rates compare to other markets?
GTA industrial vacancy remains below most comparable Canadian cities because ongoing e-commerce and logistics demand is paired with Greenbelt-constrained land supply, a combination that few other markets face at the same scale.