

TL;DR:
- Accurate forecasting of industrial space needs in the GTA requires detailed internal data, market demand analysis, and scenario planning. Misjudging space requirements can lead to costly excess or shortfall, especially in a market with long lead times and tight vacancy. Continuous validation and stakeholder alignment are essential for securing optimal facilities aligned with operational and market realities.
Getting your space forecast wrong is an expensive mistake. Commit to too little square footage and you cap growth, disrupt throughput, and scramble for short-term overflow at premium rates. Commit to too much and you carry dead occupancy cost that drains working capital for years. Learning how to forecast industrial space needs with precision is one of the highest-value exercises any operations or real estate decision-maker can undertake, particularly in the Greater Toronto Area where vacancy has tightened dramatically and lead times on quality industrial space now stretch well beyond 12 months in many nodes.
Key takeaways
| Point | Details |
|---|---|
| Start with granular data | Accurate forecasts require SKU profiles, order volumes, and storage categories before any square footage estimate is meaningful. |
| Use a two-layer model | Combine internal capacity analysis with macro market demand indicators for a complete picture of space requirements. |
| Build scenario ranges | Single-point forecasts break down under policy and trade uncertainty; upper and lower bounds protect your commitments. |
| Flow matters as much as size | Dock capacity, aisle widths, and zoning directly affect usable space and must be part of any credible estimate. |
| Validate and iterate | Forecasts go stale quickly in volatile markets; schedule quarterly reviews against actual utilisation and market absorption data. |
How to forecast industrial space needs: the data foundation
In facilities management and corporate real estate circles, the formal discipline here is called facility demand forecasting or space needs analysis. The SEO shorthand "forecasting industrial space needs" covers the same ground, but understanding the professional vocabulary matters when you are working alongside engineers, planners, and brokers who use it daily.
Before any model can produce a reliable output, you need to assemble the right inputs. The most common forecasting failure in industrial real estate is not a bad model. It is feeding a reasonable model with incomplete or aggregated data and treating the result as credible.
Strategic requirements capture at project initiation directly guides technical requirements and funding commitments. That means establishing occupancy parameters, headcount projections, intended use of each zone, and operational throughput targets before a single square metre is costed.
For warehouse and logistics users in particular, warehouse required capacity is most accurately computed using planned order quantities combined with item volume attributes, compared against available storage capacity at the storage category level. That is a precise, operationally grounded starting point that gross square footage heuristics cannot replicate.
Here is a reference table of critical data inputs and where to source them for GTA-based industrial forecasting:
| Data input | Description | Source |
|---|---|---|
| Current occupancy rate | Percentage of existing space actively in use | Internal facilities or operations team |
| SKU/order profile | Volume attributes, product dimensions, turnover velocity | Warehouse management system (WMS) |
| Storage categories | Dry, refrigerated, hazmat, bulk, rack | Operations and compliance teams |
| Headcount and shift data | Labour requirements per zone and per shift | HR and operations planning |
| GTA vacancy and absorption | Current submarket data by node (Mississauga, Brampton, Vaughan, etc.) | Market intelligence reports |
| Macroeconomic indicators | Manufacturing output index, Purchasing Managers' Index, GDP growth | NAIOP, Statistics Canada |
| Zoning and land use rules | Permitted uses, setbacks, parking ratios, truck access | Municipal planning departments |
| Lease terms and flexibility clauses | Existing commitments, renewal windows, expansion options | Legal and real estate teams |
Tools such as Oracle's Supply Chain Planning module and CoStar's market analytics platform are commonly used at the enterprise level. For mid-market operators in the GTA, a well-structured spreadsheet model fed with WMS exports and submarket data from a knowledgeable broker can achieve comparable rigour at a fraction of the cost.
Regarding macroeconomic context, NAIOP's forecasting model incorporates over 40 economic and real estate variables, including the Federal Reserve Board's Index of Manufacturing Output and the ISM Purchasing Managers' Index, alongside employment, GDP, trade, and transport data. Canadian operators should cross-reference equivalent Statistics Canada indicators, particularly manufacturing shipments and import/export volumes at the Port of Toronto and Pearson International Airport, as both directly shape GTA industrial demand.
Understanding GTA industrial zoning rules is equally non-negotiable at this stage. A site that looks adequate on paper may be restricted to light industrial uses, prohibiting the vehicle configurations or chemical storage categories your operation requires.

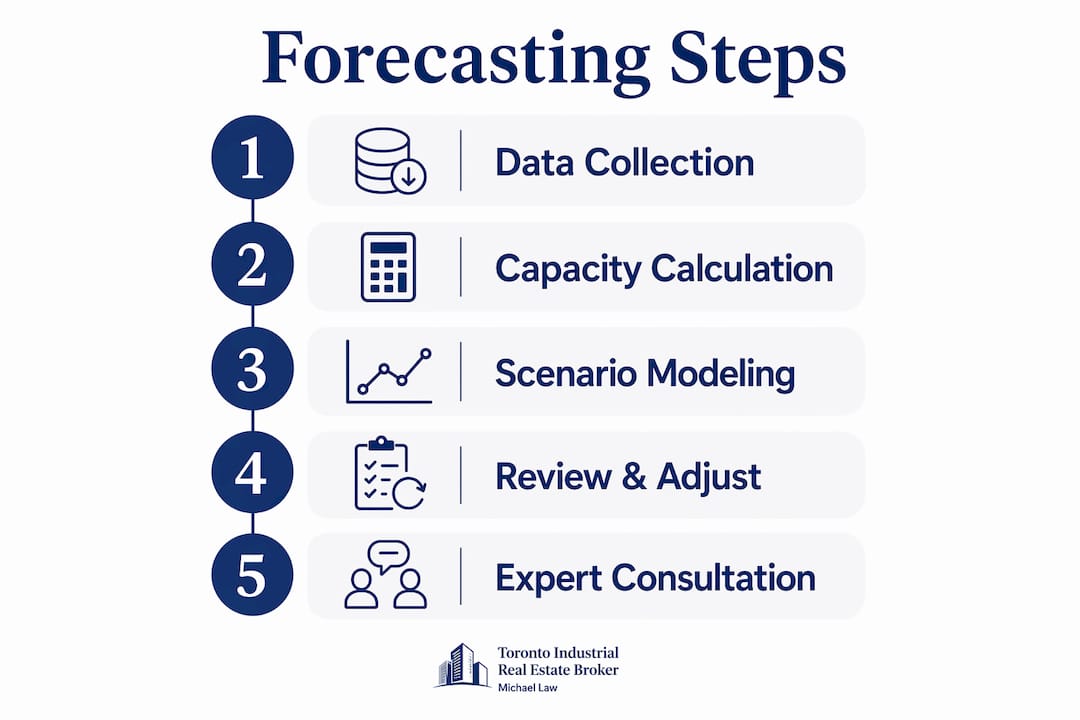
Step-by-step: building your space forecast
With your data assembled, you can move into the structured forecasting process. The methodology below reflects the two-layer approach that practitioners use: an internal capacity layer driven by your operational reality, and a market demand layer shaped by macro variables.
-
Establish your operational baseline. Calculate current utilisation by storage category, not just overall square footage. If your dry racking is at 94% utilisation while your refrigerated bays sit at 60%, you have a distorted picture if you average them together. Aggregating demand into a single undifferentiated bucket produces misleading forecasts.
-
Project order volumes forward. Work with your demand planning or sales team to generate 12, 24, and 36-month order volume scenarios. Translate those volumes into cubic metres of required storage using your SKU dimension data. Then convert cubic metres to pallet positions, and pallet positions to floor space with your racking configuration applied.
-
Add flow and throughput requirements. This is where many forecasts fall short. Operational flow considerations such as inbound and outbound routes, aisle widths, and internal zoning are vital to forecast actual usability beyond gross square footage. A facility with excellent storage density but only two dock doors may create inbound bottlenecks that render 15% of storage unusable during peak periods.
-
Layer in market demand context. Review current and projected GTA submarket vacancy rates, net absorption trends, and new supply pipelines in your target nodes. Brampton, Mississauga, and Vaughan each behave differently. An area with limited new supply and strong absorption signals a tighter market in 18 to 24 months, which should pull your timing decision forward.
-
Build three scenarios, not one. Construct a base case, an upside case (higher volume growth, additional SKU categories), and a downside case (flat volumes, reduced headcount). Forecast bounds prevent overcommitment under uncertainty. NAIOP expanded upper and lower forecast ranges specifically to reflect uncertainties around trade policy and fiscal impacts on industrial real estate demand, and GTA operators should follow the same discipline given Canada's ongoing exposure to cross-border trade policy shifts.
-
Convert to facility specifications. Translate each scenario into specific facility criteria: minimum clear height, dock door count, truck court depth, office ratio, power supply, and square footage. This step separates a useful forecast from an abstract number. A 120,000-square-foot requirement with 36-foot clear height and 24 dock doors is actionable in the market. A 120,000-square-foot requirement is not.
-
Stress test with timing sensitivity. Model the cost and operational impact of executing 12 months early versus 12 months late. In tight GTA submarkets, a 12-month delay can mean accepting an inferior site at a 20 to 30% rental premium. That sensitivity analysis often makes the business case for moving sooner.
Pro Tip: When building your scenario models, assign a probability weight to each case and calculate an expected-value output. A base case at 60% probability, upside at 25%, and downside at 15% gives you a weighted space estimate that is more defensible in a capital approval process than three unweighted options.
Common forecasting pitfalls to avoid
Even well-resourced companies make predictable errors when estimating industrial space requirements. Recognising these in advance saves time, money, and sometimes the business case itself.
-
Treating gross square footage as the primary output. Square footage is a constraint, not a specification. Two 80,000-square-foot buildings in Mississauga can have radically different usable capacities depending on column spacing, clear height, and dock configuration. Always translate your capacity forecast into facility specification before going to market.
-
Ignoring storage category distinctions. Utilisation varies significantly by storage type, and forecasts that blend refrigerated, dry, and hazmat categories into a single figure produce numbers that are accurate in aggregate but useless operationally.
-
Underestimating flow as a space driver. Dock capacity, aisle width, staging zones, and vehicle turning radii consume real square footage. A space needs analysis that allocates 100% of floor area to storage and forgets about inbound staging, returns processing, and forklift clearance will produce a forecast that fails the first week of operation.
-
Building a single-point forecast in an uncertain environment. Trade and fiscal policy changes directly affect industrial space demand. With Canada's trade exposure to the United States continuing to generate uncertainty in 2026, a single deterministic forecast is a liability rather than an asset.
-
Failing to lock requirements early. Forecasts that circulate through an organisation without a defined sign-off date rarely reach a fundable state. The GSA's space planning framework recognises that capturing strategic requirements early is essential to creating plans that can actually be acted upon and funded.
-
Not accounting for GTA submarket timing. Demand forecasting without a parallel view of supply pipeline and submarket timing leaves you with a space figure but no delivery strategy. Industrial real estate trends across the GTA in 2026 show differentiated absorption rates across nodes, which means the right forecast for Vaughan is not the right forecast for Ajax or Burlington.
Pro Tip: Build a minimum 18-month lead time assumption into any GTA facility search that requires a purpose-fit configuration. In supply-constrained nodes, the gap between identifying your requirements and occupying a suitable facility routinely exceeds that threshold, particularly if the search involves properties above 100,000 square feet.
Validating and adjusting your forecast over time
A forecast that is produced once and filed away is not a forecast. It is a historical document. Industrial space demand forecasting is most valuable when it operates as a continuous feedback loop between your operational data and real market conditions.
The comparison below illustrates the difference between a static and a dynamic forecasting approach:
| Dimension | Static forecast | Dynamic forecast |
|---|---|---|
| Frequency of review | Once at project initiation | Quarterly, aligned with operational and market cycles |
| Data inputs | Historical volumes and current occupancy | Rolling 12-month actuals plus leading economic indicators |
| Market calibration | Point-in-time vacancy snapshot | Continuous absorption and pipeline monitoring |
| Scenario updates | Fixed base case only | Scenarios revised as probability weights shift |
| Decision triggers | Milestone-based (lease expiry only) | Threshold-based (utilisation rate exceeds 85%, market vacancy drops below 3%) |
| Risk posture | Reactive | Proactive, with pre-negotiated options and flexibility clauses |
The practical mechanics of a dynamic approach involve monitoring your warehouse utilisation metrics on at least a monthly basis, comparing planned order volumes against actual receipts and shipments, and reviewing submarket reports each quarter. Validating internal forecasts against real market absorption data and evolving economic conditions meaningfully improves forecast adaptability and decision quality.
For GTA operators, the leading indicators worth tracking include Statistics Canada's monthly manufacturing shipments data, cross-border trade volumes at Windsor and Pearson, and net absorption rates across the Airport, Brampton, and Vaughan corridors. When those macro signals shift, your internal capacity model should be stress-tested against the new assumptions within 30 days.
A concrete example: a third-party logistics provider operating a 150,000-square-foot facility in Brampton set a utilisation trigger of 87% across its primary dry storage category. When that threshold was crossed in Q3, the operations and real estate teams jointly initiated a site search. Because they had maintained an ongoing forecast with scenario bounds, they could present a specific facility specification to the market immediately rather than spending three months re-running analysis. They secured a suitable option 14 months before their existing lease expiry, giving them genuine negotiating leverage on both the new facility and their renewal.
Understanding your occupancy cost structure through this process also gives you a more accurate picture of the true cost of staying too long in an undersized facility versus the cost of moving to right-sized space at current market rents.
My perspective on forecasting industrial space
I have worked through enough GTA industrial real estate transactions to have a clear view of where forecasting discipline separates operators who secure excellent facilities from those who end up in reactive bidding situations.
The conventional wisdom is to calculate your square footage, add a growth buffer, and go shopping. In my experience, that approach consistently underdelivers. The growth buffer is almost always applied uniformly across all space categories, which is rarely how actual demand distributes. A food-grade cold storage operator's refrigerated capacity will grow at a different rate than its dry storage, staging, and office components. Blending those growth assumptions produces a facility specification that fits no one scenario particularly well.
What I have seen work consistently is treating the forecast as a two-layer problem. The first layer is your internal capacity model, grounded in SKU data, order volumes, and facility flow analysis. The second layer is the market demand context, where you read submarket vacancy trends, absorption rates, and new supply timing to calibrate when to move. These two layers produce different insights, and you need both to make a confident decision.
The other thing I push clients on is scenario planning under genuine uncertainty. Canada's trade relationship with the United States has introduced real volatility into industrial demand projections. A business that assumed stable cross-border volumes in its forecasts two years ago may be operating under materially different conditions today. That does not mean you cannot plan. It means you should plan with bounded ranges and pre-negotiated flexibility clauses rather than single-point commitments.
The most valuable forecasting conversations I have with clients involve logistics, real estate, and finance in the same room at the same time. When those three functions operate in silos, you end up with a space forecast that satisfies the operations team but cannot get funded, or one that gets funded but does not reflect operational reality. Getting alignment early is not a soft practice. It directly determines whether your forecast becomes a facility.
— Michael
Work with a GTA industrial real estate specialist

Producing a credible space forecast is only the first step. Translating that forecast into a secured facility in a competitive market requires current submarket intelligence, access to off-market opportunities, and experienced negotiation on lease structure and terms. Mlawrealestate provides exactly that for industrial occupiers, investors, and developers across every major GTA corridor, from Mississauga and Brampton to Vaughan, Markham, and the Durham Region nodes.
Whether you are preparing for a lease renewal, planning a relocation, or evaluating an owner-user acquisition, you can browse available GTA industrial properties and connect directly with Michael to discuss your space requirements. For operators considering emerging nodes, the Caledon industrial market represents a growing opportunity with land availability that is increasingly scarce elsewhere in the GTA. You can also learn more about Michael's broader commercial real estate experience and advisory background through his Lennard Commercial profile.
FAQ
What data do I need to forecast industrial space requirements?
You need current occupancy rates, SKU and order volume profiles, storage category breakdowns, headcount by shift, and submarket data including vacancy and absorption rates. Macroeconomic indicators such as manufacturing output indexes and trade volumes improve accuracy at the market demand layer.
How is warehouse required capacity calculated?
Warehouse required capacity is computed by applying planned order quantities and item volume attributes against available storage capacity at the storage category level, as opposed to using gross square footage alone. This approach produces a more operationally grounded estimate.
Why should I build scenario ranges instead of a single forecast?
Single-point forecasts break down when trade policy, fiscal conditions, or demand patterns shift unexpectedly. Upper and lower bounded scenarios allow you to adjust leasing timing and facility commitments without overexposing the business to either excess space cost or capacity shortfall.
How often should I update my industrial space forecast?
At minimum, review your forecast quarterly against actual utilisation metrics and current submarket absorption data. In volatile market conditions or periods of rapid business growth, monthly reviews of the leading indicator inputs are warranted to catch shifts before they become urgent.
What makes GTA industrial forecasting different from other markets?
The GTA industrial market combines historically low vacancy across core nodes, long lead times on quality supply, differentiated absorption across submarkets like Mississauga, Brampton, and Vaughan, and significant exposure to Canada-U.S. trade policy fluctuations. These factors mean forecast timing and submarket selection carry a higher weighting than in more liquid markets.