

TL;DR:
- Cap rate is the ratio of a property's net operating income to its market value, representing an unleveraged annual income yield. It helps compare similar industrial properties across the GTA, but must be used alongside other metrics due to its limitations in capturing financing, appreciation, and market risks. Understanding local market factors and NOI quality enhances the effective application of cap rates in real estate investment decisions.
If you've spent any time evaluating income properties, you've heard the term cap rate. But what is cap rate in real estate, really? Most investors can recite the formula. Far fewer can explain what it actually tells you, what it leaves out, and how to use it correctly when comparing industrial properties across the GTA. This guide breaks down the cap rate definition from the ground up, walks through how to calculate cap rate with a real example, and shows you how to apply it with the local market context that actually moves the needle on investment decisions.
Table of Contents
- Key takeaways
- What is cap rate in real estate and how to calculate it
- Factors that affect cap rates in GTA industrial properties
- Limitations and misconceptions about cap rate
- Practical application for GTA industrial investment decisions
- Cap rate alongside other investment metrics
- My take on using cap rate in GTA industrial investing
- Work with a GTA industrial real estate specialist
- FAQ
Key takeaways
| Point | Details |
|---|---|
| Cap rate formula | Divide net operating income by current market value to get the unleveraged yield on a property. |
| NOI quality matters | Using stabilised, normalised income produces a more reliable cap rate than volatile or pro forma figures. |
| Local market context | GTA industrial submarkets show different cap rate ranges based on vacancy, location, and tenant quality. |
| Cap rate has limits | It excludes financing, depreciation, taxes, and capital expenditures, so it cannot stand alone as a return metric. |
| Use it alongside other metrics | Pair cap rate with cash-on-cash return, DSCR, and IRR for a complete picture of investment performance. |
What is cap rate in real estate and how to calculate it
The cap rate definition is straightforward: cap rate is the ratio of a property's net operating income (NOI) to its current market value, expressed as a percentage. It tells you the unleveraged annual return you would earn if you purchased the property in cash. No mortgage, no financing costs. Just pure income yield on the asset itself.
The formula looks like this:
Cap Rate = Net Operating Income ÷ Current Market Value × 100
Before you can apply this, you need to calculate NOI correctly. NOI is gross rental income minus all operating expenses, including property taxes, insurance, management fees, maintenance, and utilities paid by the owner. It does NOT include mortgage payments or debt service. Cap rate excludes financing by design, which is what makes it useful for comparing properties regardless of how they are financed.
A realistic GTA industrial example
Say you are evaluating a 20,000 square foot warehouse in Brampton. The property generates $480,000 in gross annual rent. After operating expenses of $80,000, the NOI is $400,000. The asking price is $6,250,000.

Cap Rate = $400,000 ÷ $6,250,000 = 6.4%
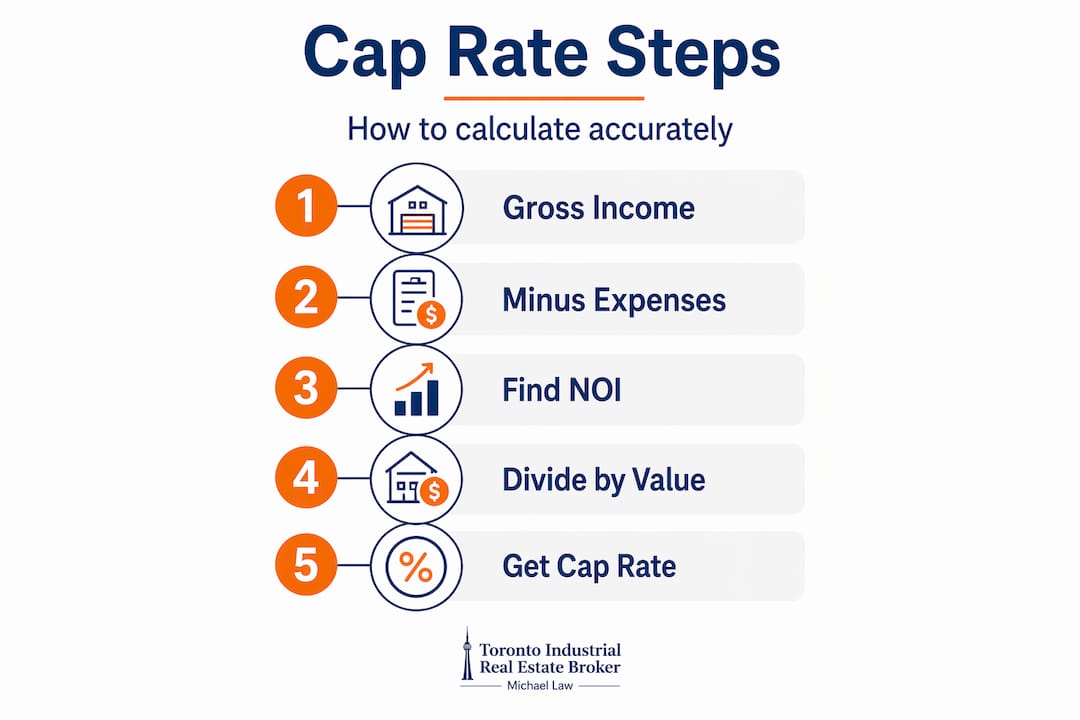
That 6.4% is your unleveraged income yield. You can now compare that figure against similar properties in Mississauga, Vaughan, or Ajax without your financing structure distorting the comparison. That is exactly the power of understanding cap rates in real estate.
Pro Tip: Always recalculate NOI yourself rather than accepting the seller's stated figure. Sellers sometimes inflate NOI by excluding management fees or deferring maintenance, both of which will hit your actual returns.
Direct capitalisation also runs this formula in reverse. If you know the market cap rate and the NOI, you can estimate property value: Value = NOI ÷ Cap Rate. This is one of the most common valuation techniques used by appraisers and brokers in commercial real estate.
Factors that affect cap rates in GTA industrial properties
Cap rates do not exist in a vacuum. They reflect a combination of property-level, market-level, and macroeconomic variables. Cap rates vary by property type, location, lease quality, and economic factors like interest rates and GDP. Understanding what drives those variations is what separates informed investors from those who chase a number without context.
Property and tenant factors
- Asset quality and condition: Newer, well-maintained industrial buildings with modern clear heights (36 feet and above), dock-level loading, and adequate power attract better tenants and carry lower cap rates.
- Tenant covenant strength: A long-term lease with a national logistics company is a fundamentally different risk profile than a month-to-month lease with a small local operator.
- Lease term remaining: Properties with five or more years of lease term remaining on strong-credit tenants trade at compressed cap rates because the income stream is predictable.
- Expected rent growth: In markets where rents are rising, buyers accept lower cap rates today because they are pricing in future NOI increases.
GTA submarket dynamics
GTA industrial cap rates vary noticeably across submarkets. High-demand corridors with limited vacancy, such as the Airport/Mississauga node and the Vaughan/400 corridor, consistently attract more capital and compress cap rates. Markets with higher vacancy or older building stock, such as certain Hamilton or Oshawa nodes, tend to offer wider cap rates to compensate for perceived risk.
| GTA submarket | Typical cap rate range | Key driver |
|---|---|---|
| Mississauga (Airport corridor) | 4.5% – 5.5% | Low vacancy, premium tenant demand |
| Vaughan / Highway 400 | 4.75% – 5.75% | Strong logistics demand, new supply |
| Durham Region (Ajax/Whitby) | 5.5% – 6.5% | Affordability-driven demand, growing market |
| Hamilton | 6.0% – 7.0% | Lower land values, older building stock |
| Brampton / 410 corridor | 5.0% – 6.0% | High throughput, e-commerce activity |
These ranges shift with market cycles. They are useful for orientation, not as hard benchmarks.
Macroeconomic influences
Rising interest rates lead to higher cap rates because the cost of capital increases. When investors can earn 5% on low-risk bonds, they demand a higher income yield on riskier real assets. The rate cycle of 2022 to 2024 demonstrated this clearly. As the Bank of Canada raised overnight rates aggressively, cap rates in several GTA industrial submarkets expanded modestly after years of historic compression. Understanding this relationship helps you anticipate where cap rates might move before making a long-term acquisition.
You can also explore the impact of vacancy rates on cap rate movements in specific GTA submarkets for a more granular view.
Limitations and misconceptions about cap rate
Cap rate is one of the most misused metrics in real estate. The number is deceptively simple, and that simplicity causes investors to draw conclusions it was never designed to support.
Here are the most common limitations you need to keep front of mind:
- It ignores financing entirely. A cap rate below your mortgage rate means you are paying more to borrow than you are earning on the unleveraged asset. Two properties with the same cap rate can produce radically different equity returns once leverage enters the picture.
- It is a point-in-time snapshot. Cap rate captures income and value at a single moment. It does not account for lease rollover risk, capital expenditures in years three through five, or changing market rents.
- It excludes appreciation. A 5% cap rate property in Mississauga that appreciates 20% over five years delivers a very different total return than a 5% cap rate property in a flat market. Cap rate alone will never tell you that.
- It does not reflect taxes or depreciation. Your after-tax return depends on your tax situation, amortisation schedules, and capital cost allowance claims, none of which are captured in the cap rate formula.
- It depends entirely on NOI quality. Capitalising volatile or pro forma income rather than stabilised, sustainable NOI produces a distorted valuation. If a seller is projecting future rents rather than reporting current in-place income, your cap rate calculation reflects a story, not a fact.
Pro Tip: Ask for in-place NOI and trailing twelve-month actuals before running any cap rate calculation. Sellers typically present stabilised or projected figures. The gap between those numbers and actual historical income is where deals fall apart post-closing.
The cap rate is best used for relative valuation against comparable, stabilised properties in the same submarket. It answers the question: "Is this property priced in line with others like it?" It does not answer: "Will this investment make me money?"
Practical application for GTA industrial investment decisions
Once you understand the mechanics and limits, cap rate becomes a genuinely useful tool. Here is how experienced investors apply it when evaluating GTA industrial acquisitions.
Estimating property value from market cap rates
If you know that stabilised industrial assets in the Brampton/410 corridor are trading at 5.5% cap rates, and you have identified a property with a verified NOI of $550,000, you can estimate fair market value at roughly $10 million ($550,000 ÷ 0.055). This reverse calculation is exactly what appraisers use in the direct capitalisation approach to property valuation. For a deeper look at how this fits into the broader valuation process, the GTA industrial valuation guide covers additional methods and their applications.
Comparing two acquisition opportunities
Consider two properties, both listed at $8,000,000:
| Property | NOI | Cap rate | Location | Lease term remaining |
|---|---|---|---|---|
| Property A (Mississauga) | $400,000 | 5.0% | Airport corridor | 7 years, AAA tenant |
| Property B (Hamilton) | $520,000 | 6.5% | Industrial park, older stock | 2 years, local tenant |
Property B offers a higher cap rate, which might initially appear more attractive. But the combination of a short lease with a weaker tenant, older building, and higher ongoing capital expense exposure changes the risk profile substantially. Property A's 5.0% cap rate reflects lower risk and more predictable income. Neither is automatically the better buy. The analysis depends on your risk tolerance, financing strategy, and view on Hamilton's market trajectory.
Adjusting for market conditions in 2026
The GTA industrial market has seen modest cap rate expansion from the historic lows of 3.5% to 4.5% recorded in 2021 and 2022. In 2026, stabilised GTA industrial assets in premium locations are transacting in the 4.75% to 5.75% range depending on asset quality and submarket. Buyers underwriting acquisitions today need to model cap rate sensitivity carefully. A 50-basis-point cap rate expansion on a $10 million asset represents close to $1 million in lost value, assuming flat NOI.
- Use market cap rate data from recent comparable transactions, not asking prices
- Adjust your underwriting cap rate upward when lease terms are short or tenant credit is uncertain
- Factor in exit cap rate assumptions for your hold period return projections
Cap rate alongside other investment metrics
Cap rate is most valuable when used as part of a broader analytical framework. On its own, it answers a narrow question. Combined with other metrics, it gives you a genuinely complete picture of an investment.
Cash-on-cash return measures the annual pre-tax cash flow relative to the actual equity invested, including your down payment and closing costs. Unlike cap rate, it accounts for your specific financing structure. Two investors buying the same property with different mortgage terms will report different cash-on-cash returns, even though the cap rate is identical for both.
Debt service coverage ratio (DSCR) tells lenders and investors whether NOI is sufficient to cover mortgage payments. A DSCR of 1.25 means the property generates 25% more income than needed to service the debt. Most commercial lenders in Canada require a minimum DSCR of 1.20 to 1.25 on industrial acquisitions. If your cap rate is below your mortgage rate, your DSCR will be under pressure.
Using cap rate alongside DSCR and cash-on-cash return helps investors avoid the trap of over-valuing a property that looks attractive on yield but cannot service its own debt.
Internal rate of return (IRR) and discounted cash flow (DCF) analysis incorporate the full holding period, including rent growth, capital expenditures, vacancy, and the eventual sale price. These are the metrics serious institutional investors rely on for acquisition decisions. Cap rate feeds into this analysis as both an entry-year yield benchmark and an assumption for exit valuation.
The cap rate reflects risk and return expectations embedded in market pricing. It will always have a role in investment analysis. The key is knowing what role that is, and not asking it to do more than it can.
My take on using cap rate in GTA industrial investing
I've spent years advising investors on industrial acquisitions across the GTA, and the most common mistake I see is treating cap rate as a verdict rather than a starting point. I've watched buyers walk away from exceptional deals because the cap rate looked thin on paper, and I've seen others overpay for properties with inflated NOI that capped at an attractive number but had serious lease and capital issues underneath.
In my experience, the quality of the NOI matters far more than the percentage itself. A 4.75% cap rate on a property with a seven-year lease to a national tenant in the Mississauga Airport corridor is a fundamentally different proposition than a 5.5% cap rate on a multi-tenant property in a softening submarket with two leases rolling in eighteen months. The numbers alone won't tell you that. Local market knowledge will.
What I've found actually works is using cap rate as a quick filter to screen opportunities, then immediately going deeper on the income quality, tenant covenant, lease structure, and physical condition of the asset. I also always model at least two cap rate scenarios on exit: one in line with entry conditions and one with 50 to 75 basis points of expansion. If the deal only works under the optimistic scenario, it needs a harder look.
The GTA industrial market remains one of the most competitive in Canada. Understanding cap rates is table stakes. Using them intelligently, alongside real market data and thorough due diligence, is what separates successful acquisitions from expensive lessons.
— Michael
Work with a GTA industrial real estate specialist

Understanding the theory behind cap rates is one thing. Applying it correctly to live transactions in the GTA industrial market is another. At Mlawrealestate, I advise private investors, institutions, and owner-users on industrial acquisitions, dispositions, and leasing across every major GTA submarket, from the Mississauga Airport corridor to Burlington, Hamilton, and Durham Region. Whether you're evaluating your first acquisition or managing a multi-asset portfolio, having access to real transaction data and submarket-level insight makes a measurable difference in the decisions you make.
Browse current GTA industrial listings to see what's actively trading, or explore opportunities in specific markets such as industrial real estate in Burlington and Hamilton industrial properties. For background on my track record and approach, visit my profile at Lennard Commercial Realty. The right property at the right cap rate exists. Let's find it.
FAQ
What is cap rate in real estate?
Cap rate (capitalisation rate) is the ratio of a property's net operating income to its current market value, expressed as a percentage. It represents the unleveraged annual income yield an investor would earn if the property were purchased without financing.
How do you calculate cap rate?
Divide the property's net operating income (gross rental income minus operating expenses, excluding debt service) by the current market value, then multiply by 100. For example, a property with $400,000 NOI and a $8,000,000 value has a 5.0% cap rate.
What is a good cap rate for industrial property in the GTA?
In 2026, stabilised GTA industrial properties in premium submarkets like Mississauga and Vaughan typically trade between 4.75% and 5.75%. Secondary markets like Hamilton and parts of Durham Region offer cap rates in the 6.0% to 7.0% range, reflecting higher perceived risk.
What does a lower cap rate mean?
A lower cap rate indicates a higher property value relative to income, typically reflecting stronger tenant quality, longer lease terms, a high-demand location, or lower perceived risk. Investors accept lower yields when the income stream is more predictable and the asset is more liquid.
Is cap rate the same as return on investment?
No. Cap rate measures unleveraged income yield at a single point in time. It excludes financing costs, appreciation, taxes, and capital expenditures. Total return on investment depends on your financing structure, hold period, exit price, and tax situation, none of which cap rate captures.