
TL;DR:
- Connected data platforms enable real-time insights, improving decision accuracy in GTA industrial real estate.
- Accurate decision-making relies on primary, up-to-date market data segmented by asset class and submarket.
- Asking strategic questions enhances data interpretation, giving stakeholders a competitive edge.
Experience and relationships matter in GTA industrial real estate, but they are no longer enough on their own. Margins for error have tightened sharply across leasing, acquisitions, and asset management as competition for quality space intensifies. A tenant who signs a five-year lease in an overpriced submarket without reviewing current absorption data can face hundreds of thousands in excess occupancy costs. An investor who relies on a broker's anecdote instead of verified transaction comps risks mispricing an acquisition by millions. Connected data platforms that integrate accounting, leasing, and operational data now deliver real-time insights that gut instinct simply cannot match.
Table of Contents
- What kinds of data matter for GTA industrial real estate?
- How integrated data platforms transform decision-making
- Expert nuance: pitfalls and best practices in GTA data analysis
- Applying data: real-world examples for GTA industrial stakeholders
- A fresh perspective: why true data advantage means asking better questions
- Next steps: turn GTA data into strategic growth
- Frequently asked questions
Key Takeaways
| Point | Details |
|---|---|
| Primary data leads | Always prioritise current, direct market reports for the most accurate GTA industrial insights. |
| Integrated platforms boost results | Centralising leasing, financial, and occupancy data enables swifter and more confident decisions. |
| Expert nuance matters | Interpret Class A vs B market dynamics carefully and adjust for pipeline realities. |
| Success is context-driven | GTA stakeholders gain more by framing smarter questions than by chasing bigger spreadsheets. |
What kinds of data matter for GTA industrial real estate?
Not all data is created equal, and the first mistake most stakeholders make is treating every number the same. Knowing which data types drive decisions and which simply create noise is the real starting point.
The core data categories you need to understand are:
- Market fundamentals: Vacancy rates, net asking rents, and absorption figures broken down by submarket (Brampton, Mississauga, Vaughan, Durham Region, etc.)
- Leasing data: Lease commencement dates, term lengths, free rent periods, and tenant improvement allowances from recent comparable transactions
- Supply pipeline: New industrial developments under construction or proposed, broken down by delivery date and building class
- Transaction comps: Verified sale prices and cap rates from closed investment transactions in each corridor
- Tenant demand signals: Active requirements in the market, space shortlisted by logistics, e-commerce, and manufacturing users
- Operating metrics: Net operating income (NOI), operating cost escalations, and lease-to-lease rent growth across a portfolio
For site selection in the GTA, local submarket data is non-negotiable. A blended GTA-wide vacancy figure tells you very little when you are deciding between a logistics hub in Milton versus a mid-bay facility near the 427 corridor in Etobicoke. Each node behaves differently based on infrastructure access, labour availability, and zoning constraints.
Primary versus secondary data is another critical distinction. Primary reports from firms like Colliers or JLL offer better accuracy for leasing, investing, and market analysis than broker summaries or aggregated third-party platforms that may lag by a full quarter or more. Secondary sources have their place for high-level orientation, but operational decisions demand primary research.
When using market reports to support a lease negotiation or acquisition, always confirm when the data was collected and which properties were included in the sample. A survey conducted in Q3 2025 will not reflect post-holiday absorption patterns or a major tenant departure that closed in January 2026.
For those tracking 2026 investor insights, the combination of easing new supply and persistent tenant demand in select corridors is creating windows that quarterly data can surface well before they become obvious.
| Data type | Primary source | Update frequency |
|---|---|---|
| Vacancy and absorption | Colliers, JLL, CBRE | Quarterly |
| Transaction comps | Brokerages, Land Registry | Ongoing |
| Supply pipeline | Municipal permits, developer disclosures | Monthly |
| Leasing terms | Primary broker surveys | Quarterly |
| Portfolio metrics | Integrated platforms | Real-time |
Pro Tip: Always prioritise current quarterly data from recognised primary survey sources when making leasing or investment decisions. Data older than six months in the GTA market can actively mislead you.
How integrated data platforms transform decision-making
Having the right data categories is one thing. Being able to act on them quickly and accurately is another challenge entirely, and this is where integrated platforms change the game.
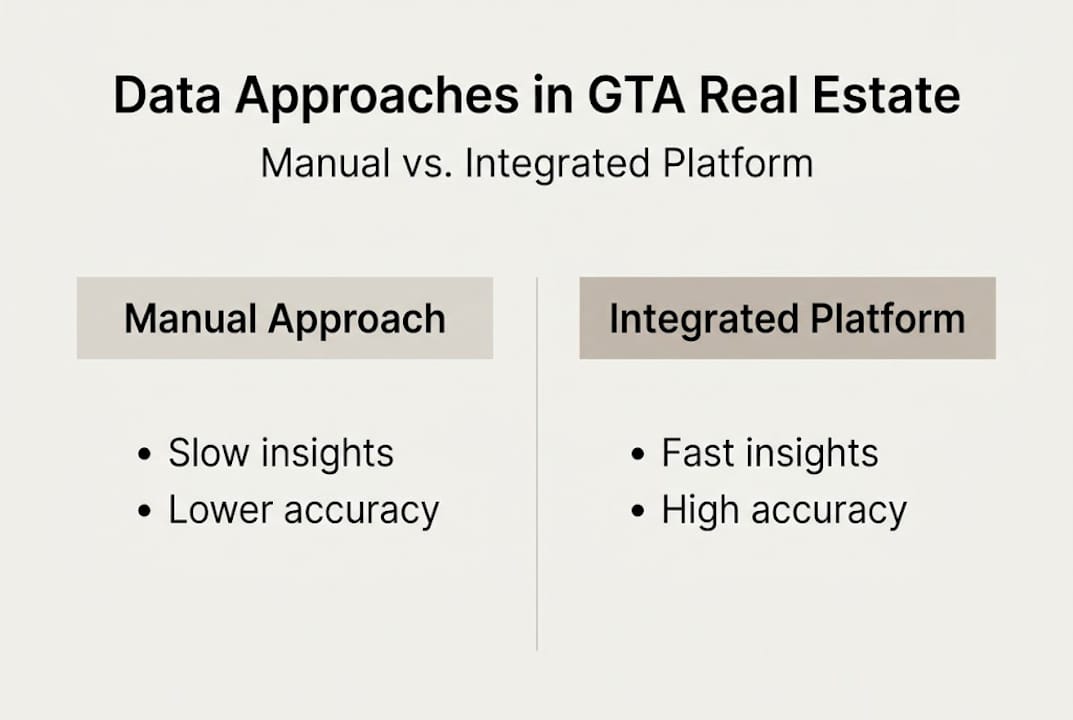
Manual data gathering in the GTA industrial market is slow and fragile. A typical asset manager might pull vacancy data from one source, lease expiry schedules from a spreadsheet, and operating cost actuals from an accounting system, then spend two days reconciling numbers before a meaningful decision can be made. By the time the picture is clear, the opportunity may be gone.

Connected platforms like Yardi deliver real-time dashboards, automate lease abstraction, and boost portfolio performance by eliminating manual reconciliation steps and surfacing risks proactively. AI-driven lease abstraction alone reduces the time it takes to review a portfolio of 20 or 30 leases from days to hours.
Here is what a practical transition to an integrated platform looks like:
- Audit your current data sources. Identify where leasing, accounting, and market data currently live and who owns each data set.
- Prioritise portfolio-level integration first. Start by connecting lease administration and financial reporting before scaling to market benchmarking modules.
- Map key decision triggers. Define which metrics (e.g., lease expiry within 18 months, vacancy rate crossing 4%) should generate automated alerts.
- Train your team on interpretation, not just access. A dashboard no one reads correctly is just an expensive screen.
- Review outputs quarterly against primary market surveys. Platform data is only as strong as the inputs; validate against Colliers or CBRE reports each quarter.
| Approach | Time to insight | Accuracy | Scalability |
|---|---|---|---|
| Manual data gathering | Days to weeks | Moderate | Low |
| Integrated platform | Real-time | High | High |
| Broker summary only | Days | Variable | Low |
For those developing market intelligence strategies, the shift to integrated platforms is not a technology upgrade. It is a competitive positioning move. Investors who can model a scenario across their entire GTA portfolio in an afternoon outmanoeuvre those who need a week.
Sale-leaseback strategies, for example, depend heavily on real-time cap rate data and portfolio NOI visibility. Without integrated data, timing these transactions is largely guesswork.
Pro Tip: Start with portfolio-level integration before attempting a firm-wide platform rollout. A phased approach surfaces quick wins and builds internal confidence in the new system.
Expert nuance: pitfalls and best practices in GTA data analysis
Getting access to data is now relatively straightforward. Using it without falling into well-worn traps is where most stakeholders still struggle.
One of the most persistent errors is treating Class A and Class B industrial assets as part of the same market when interpreting vacancy or rent data. In the GTA, these two segments often behave in opposite directions simultaneously. A wave of new Class A logistics product in Brampton can push Class A vacancy slightly higher while Class B small-bay space in Etobicoke or Scarborough remains extremely tight. Averaging across both produces a number that accurately describes neither.
Pipeline data carries its own complexity. Experts recommend distinguishing primary reports from secondary ones, and paying attention to Class A versus Class B property nuances and pipeline slowdowns. In the GTA specifically, permitting delays and construction cost pressures have pushed several speculative projects back by 12 to 18 months, meaning supply that looked imminent in 2024 is only arriving now. Stakeholders who read a pipeline report without accounting for these delays overestimate near-term supply and underestimate current leverage as a tenant or seller.
The difference between a good data user and a great one is not the volume of reports they read. It is whether they know which questions the data cannot answer alone.
Common pitfalls and winning practices worth noting:
- Pitfall: Relying on market-wide averages for submarket-specific decisions
- Pitfall: Using broker summaries as primary data without cross-referencing original survey methodology
- Pitfall: Ignoring lease structure differences when comparing rent comps (net versus gross lease terms distort comparisons)
- Best practice: Segment your data by asset class, building size tier, and submarket before drawing any conclusions
- Best practice: When monitoring industrial trends, track rolling 12-month absorption, not just point-in-time vacancy snapshots
- Best practice: Cross-reference reports from at least two primary sources when making decisions above a certain deal value threshold
For stakeholders exploring JLL alternatives or comparing data providers, the methodology behind the survey matters as much as the headline figure.
Applying data: real-world examples for GTA industrial stakeholders
Theory becomes real when you see the outcomes that proper data application produces. These scenarios reflect the kinds of situations GTA stakeholders encounter regularly.
Scenario one: avoiding an overpriced submarket. A mid-sized manufacturer in Mississauga was approaching lease expiry and received a renewal proposal from their landlord at a rate significantly above their current rent. Their first instinct was to accept quickly, concerned about disruption. A review of current quarterly leasing data revealed that vacancy in their immediate submarket had risen slightly over the prior two quarters due to a cluster of new availabilities from a single large occupier's downsizing. Armed with that context, they negotiated a more competitive rate and secured additional tenant improvement funds.
Scenario two: timing a sale-leaseback. An investor holding a GTA distribution facility used portfolio data to identify that cap rates in their submarket had compressed to a cyclical low while their in-place rent was slightly below market, creating maximum asset value. The steps they followed:
- Confirm cap rate trend using primary transaction comps from the prior 18 months
- Model the difference between current in-place rent and market rent to quantify the upside narrative for a buyer
- Identify a leaseback term that provided occupancy certainty to attract institutional buyers
- Time the marketing launch ahead of a known competing asset coming to market
- Close at pricing that exceeded their original projection by a meaningful margin
Integrated data analysis enables more confident asset decisions and competitive performance across exactly these types of scenarios.
Tangible benefits GTA stakeholders consistently report when they move to data-driven approaches:
- Faster lease execution due to pre-validated comp data entering negotiations
- Lower occupancy costs through better-timed renewals and submarket targeting
- Higher NOI realised on dispositions by identifying peak pricing windows
- Reduced time on market for investment assets through stronger marketing narratives
For those interested in boosting investor confidence, consistent data habits build the credibility that attracts co-investment partners and institutional capital.
A fresh perspective: why true data advantage means asking better questions
Here is something that does not get said enough: the GTA stakeholders consistently winning with data are not necessarily those with access to the most reports. They are the ones who ask sharper questions before they open a single spreadsheet.
It is easy to generate a dashboard. Every platform can produce charts. The real discipline is knowing what to challenge. Is the vacancy rate moving because of new supply or tenant departures? Is the rent growth figure distorted by a few large trophy leases that do not represent the bulk of the market? Is the pipeline number inclusive of projects that will almost certainly never proceed?
Those who consult a strong real estate advisor use data to pressure-test assumptions, not just confirm them. That distinction separates good decisions from great ones. The future winners in GTA industrial real estate will not be those who simply have more data. They will be the ones who build a habit of questioning their own first read of the numbers.
Pro Tip: Regularly challenge your team's data assumptions. Ask what the data does not show, not just what it does.
Next steps: turn GTA data into strategic growth
Understanding what data matters and how to apply it is a significant advantage. But translating that understanding into real leasing or investment outcomes requires local expertise alongside the numbers.

Michael Law Commercial Real Estate works with GTA industrial tenants, property owners, and investors to combine institutional-grade market intelligence with on-the-ground advisory experience. Whether you are negotiating a lease renewal, evaluating an acquisition, or planning a portfolio repositioning, we bring the data context and strategic clarity to make each decision count. See GTA listings or reach out directly to start a conversation about your specific situation.
Frequently asked questions
Why is primary market data more reliable than secondary summaries in GTA industrial real estate?
Primary reports come directly from trusted industry sources and offer the latest market realities, avoiding the delays and inaccuracies common in aggregated summaries. In a fast-moving market like the GTA, even a one-quarter lag can meaningfully distort your read of conditions.
How does AI change the process of leasing industrial properties in the GTA?
AI for lease abstraction and market survey analysis surfaces portfolio risks and opportunities far faster than traditional manual reviews. What once took a team several days can now be completed in hours, giving stakeholders more time to act on what the data reveals.
What pitfalls should investors avoid when interpreting GTA market data?
Avoid treating Class A and Class B market data as interchangeable, and always factor in current supply pipeline slowdowns for an accurate read. Experts recommend paying close attention to these nuances before drawing conclusions from any single headline figure.